| Version 54 (modified by wojtekp, 12 years ago) (diff) |
|---|
DCWoRMS Documentation and User Guide
Introduction
Data Center workload and resource management simulator (DCWoRMS) is a simulation tool based on GSSIM framework developed by PSNC. GSSIM provides an automated tool for experimental studies of various resource management and scheduling policies in distributed computing systems. It achieves this through a flexible design of architecture and interactions between scheduling components, a possibility of plugging scheduling algorithms into the simulated environment, modelling synthetic workloads and adopting real traces in popular formats. DCWoRMS extends its basic functionality and adds additional tools on top of it. They enable flexible and extensible configuration of the computing infrastructure topology both on logical and physical level. Energy aspects and virtualization technologies could thus be added to the simulation as well as several other features.
DCWoRMS architecture
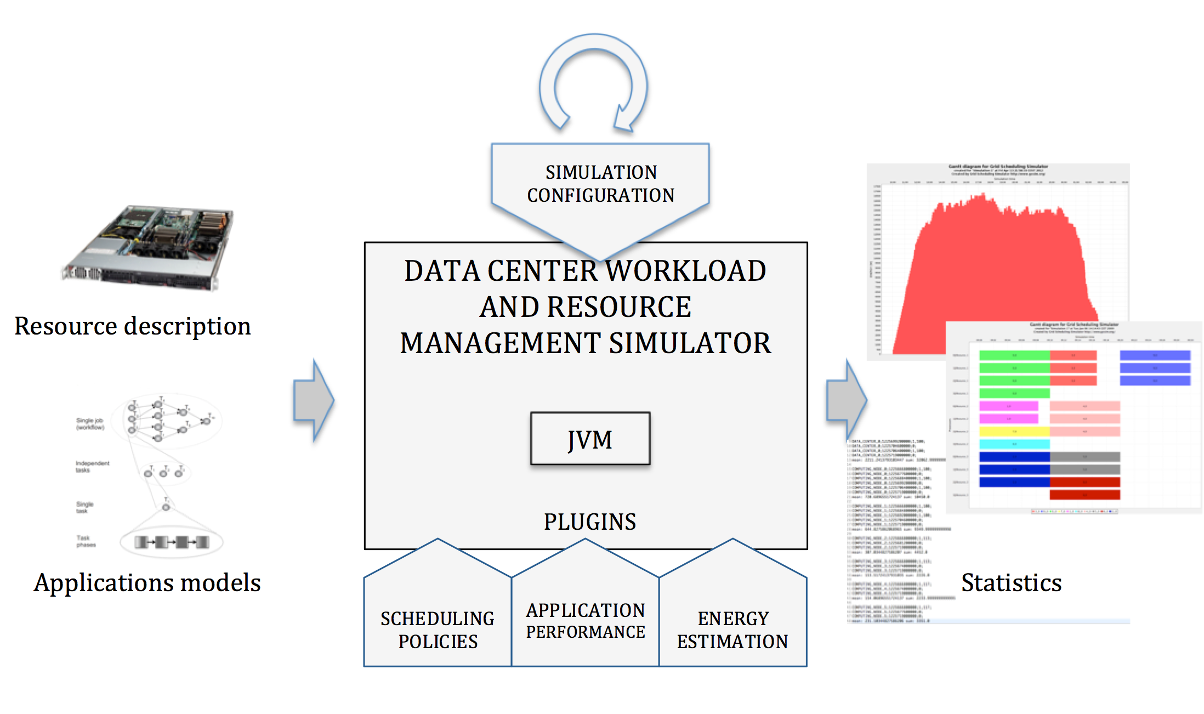
The following figure presents the overall architecture of the simulation tool.
 .
.
In general, input data for the DCWoRMS consist of a description of workload and resources. Input data can be read from real traces (for details see sections below) or generated using the generator module. However, the key elements of the presented architecture are plugins. They allow a researcher to configure and adapt the simulation framework to his/her experiment scenario starting from modeling job performance, through energy estimations up to implementation of resource management and scheduling policies. Each plugin can be implemented independently and plugged into a specific experiment. Results of experiments are collected, aggregated, and visualized using the statistics tool. Due to a modular and plug-able architecture DCWoRMS enables adapting it to specific resource management problems and users’ requirements.
Input data
In general, input data in DCWoRMS consist of a single configuration file, description of workload and resources. Users may both generate new or read the existing synthetic data. Third party real workloads can also be imported by DCWoRMS. If any parameters are missing after importing a workload, they can be generated by DCWoRMS and added.
Configuration file
The Experiment configuration file has typical, java resource bundle format. List of all available parameters and their interpretation is available below.
- resdesc - path to file containing description of resources (required)
- readscenario.workloadfilename - path to workload file (in swf or gwf format) (required)
- readscenario.inputfolder - path to directory with xml job descriptions
- createscenario.tasksdesc - path to xml file which describes detail workload generator configuration
- createscenario.outputfolder - path to directory where all generated jobs will be placed
- createscenario.workloadfilename - name of workload file in swf format which will be generated
- createscenario.overwrite_files - determines if previously generated files should be overwritten. Two possible values of this field are: "true" and "false".
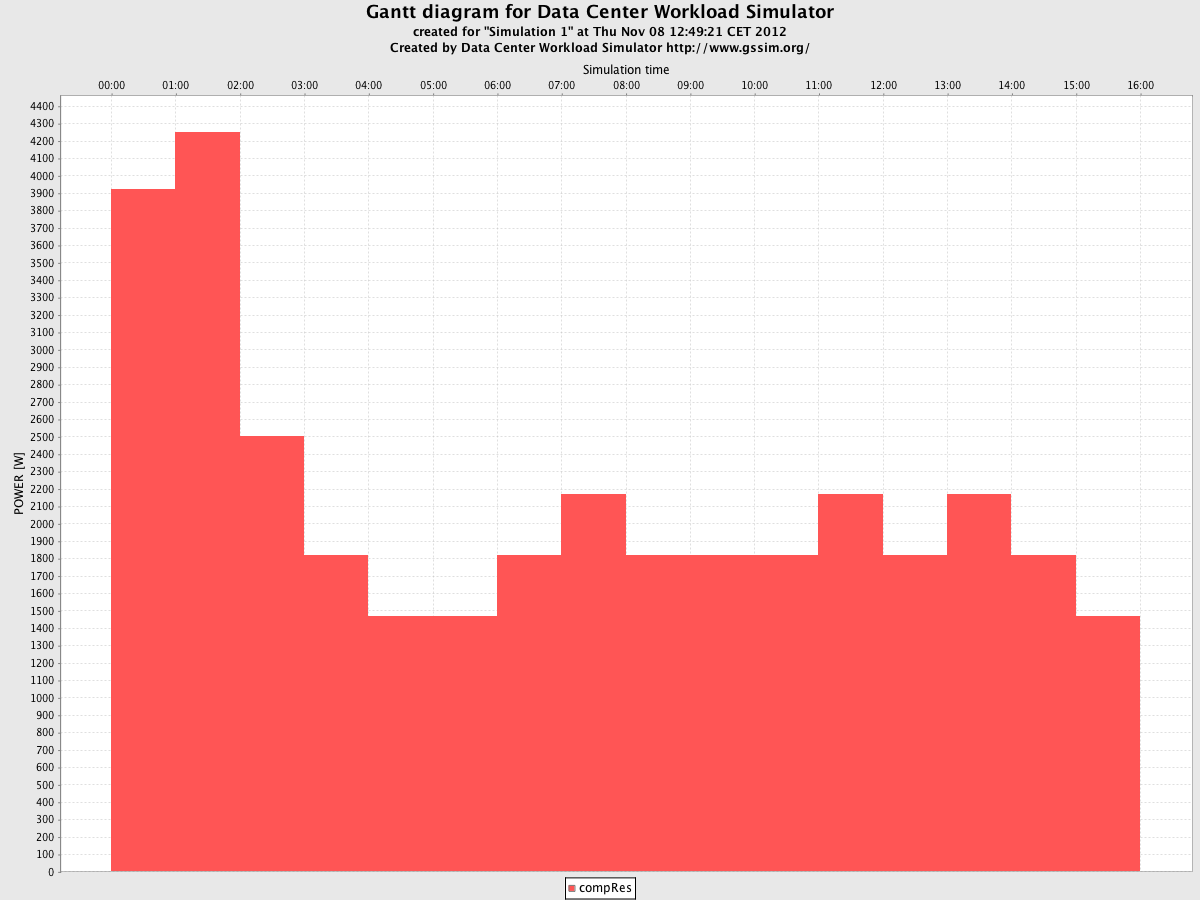
- creatediagrams.gantt - determines if gantt chart should be generated. Two possible values of this field are: "true" and "false", deafualt value: "false".
- creatediagrams.tasks - determines if tasks execution times diagram should be generated. Two possible values of this field are: "true" and "false", deafualt value: "false".
- creatediagrams.taskswaitingtime - determines if tasks waiting time gantt diagram should be generated. Two possible values of this field are: "true" and "false", deafualt value: "false".
- creatediagrams.resutlization - determines if resource utlization chart should be generated. This field should contain the types of resources for which the diagram should be created
- creatediagrams.respowerusage - determines if resource power usage chart should be generated. This field should contain the types of resources for which the diagram should be created
Parameters from readscenario and createscenario groups should be used mutual exclusively.
Path to this configuration file is the main argument of the DCWoRMS program. It should be used as follows:
java simulator.DataCenterWorkloadSimulator path/to/experiment.properties
Resource description
Resource description contains definition of resources both on physical (including data centers, containers, racks, nodes, processors, cores etc.) as well as on logical (scheduling entities) level.
It is provided using an XML-based format, see - DCWormsResSchema.xsd
Workload description
Workload contains information about jobs, their structure, resource requirements, relationships, time intervals etc. We assumed a model in which each job consists of one or more tasks. A job may contain preceding constraints between tasks (workflow). The next sections provide information on how workloads are described and generated in DCWoRMS.
The workload used to perform experiment consists of two parts: required swf/gwf format file and optional xml job description. Swf is the standard workload format, described by Dror Feitelson - see http://www.cs.huji.ac.il/labs/parallel/workload for details. Xml job description format is described by following xsd schema GrmsJobDescriptionSchema.xsd
Better flexibility and expected functionality is achieved in DCWoRMS by introducing support of new swf header comments:
StartTime - defines moment in time when the simulation starts. If it is not provided, then "Thu Jan 01 01:00:00 CET 1970" is used.
Example:
;StartTime: Mon Nov 03 10:00:00 CET 2008
PUSpeed - defines processing unit speed. This value has no predefined unit. It is up to you how this field is interpreted, for example instruction per second or million of instructions per second. If it is not provided, then default value 1 is used. The value of PUSpeed is used to estimate task length expressed in instructions, which is calculated as multiply of PUSpeed value and Run Time and Number of Allocated Processors fields.
Example:
;PUSpeed: 1
IDMapping - this section allows you to join multiple jobs from swf file into single job with multiple tasks. IDMapping section consist of:
- begin line: ;IDMapping: swfID:jobID:taskID
- mapping between swf job id and new job and task id: ; id form swf file:new job id:task id
- end line: ;IDMapping: end
Example: Assume, that swf file contains two tasks with id 1 and 2. You can create new job, with two tasks by defining following mapping:
 ;IDMapping: swfID:jobID:taskID
 ; 1:4:10, 2:4:20
 ;IDMapping: end
New job with id = 4 consisting of two tasks with id 10 and 20 will be created.
The only constraint of IDMapping section is that swf jobs, which will become tasks in new job, must occur in swf one by one. No other jobs are allowed between these swf jobs which are mapped to tasks of one new job.
The experiment can be executed with usage of single swf file or swf file with xml extension. If single swf is used, then task requirements like cpu count and requested memory are read directly from swf file. Notice, that information included in swf file is insufficient for using advance reservation in scheduling algorithm. To do so, you must provide xml extension of each job description and fill up its executionTime section. In xml files you can use any ids for job and tasks but you must provide correct IDMapping section (in swf file header) between xml job/task ids and swf job id. Otherwise, task start up parameters like submit time or task length in instructions will not be calculated correctly. If xml job description is used, then task requirements are read from xml description instead of swf file.
Workload generation
The main goal of workload design was to ensure, that all job descriptions which were used in real resource management system like GRMS or obtained from swf/gwf log can be used to perform experiment in DCWoRMS simulator. However, it my be difficult for all users to reach such workloads, therefore workload generator was created.
Workload generator allows you to create any number of jobs and tasks, with sophisticated resource and time requirements. The result of generation process are: desired number of job descriptions in xml format and swf file with job descriptions and all necessary header parameters (see WorkloadSchema.xsd for details).
Configuration options are provided by two files:
- *.properties file, which should provide values of all parameters from createscenario group and resdesc parameter (see configuration file for details)
- xml task configuration file, which is described by xsd schema WorkloadSchema.xsd and contains configuration of random numbers generators, used to create job/task/workload parameters.
Details about properties file are described above. Following part of this section describes all elements of xml configuration file.
Main workload configuration elements:
SimulationStartTime
Defines start time of the simulation in human readable form. The value should be provided in xsd time format. See www.w3.org for details.
Example:
<SimulationStartTime>2009-01-15T10:00:00</SimulationStartTime>
JobCount
Defines number of jobs to be generated. This element is used as an alternative for <SimulatonTime/>. <JobCount/> is element of type RandParams.
Example shows how to create exactly 100 jobs:
<JobCount avg="100" distribution="constant"/>
SimulationTime
Defines length of the simulation. Generator will create number of jobs which can be executed in order during SimulationTime. The value should be provided in xsd duration format. See www.w3.org for details. This element is used as an alternative for <JobCount/>.
TaskCount
Defines number of tasks in each job.
<TaskCount/> is element of type RandParams.
Example shows how to configure generator to create minimum 1 and maximum 10 tasks in each job. The average number of tasks in job will be 5, with standard deviation 3.0 and normal distribution.
<TaskCount avg="5" min="1" max="10" stdev="3.0" distribution="normal"/>
TaskLength
Defines length of the task in number of instructions. This value will be translated to the seconds with assumption that task of this length will be executed on a single and the slowest processor. The minimum speed of the processor is fixed as a minimum value of cpuspeed host parameters from resource description. The resource description file is specified by resdesc parameter in *.properties file.
<TaskLength/> is element of type RandParams.
Example shows how to configure generator to create task of minimum 500 and maximum 1500 instructions. The average length of all tasks will be 1000 instructions with standard deviation 500.0 and normal distribution.
<TaskLength avg="1000" min="500" max="1500" stdev="500.0" distribution="normal"/>
The value of all fields in swf file expressed in seconds are calculated as division of task length in instructions and minimum speed of the single processor. If the minimum speed of the processor is 2, then the value of runtime field in swf file for task of length 764 instructions will be calculated as 764/2 = 382 seconds.
JobPackageLength
Defines number of jobs which have the same submit time. Tasks which belongs to one job have always the same submit time. In swf file, submit time is interpreted as number of seconds after simulation start time.
<JobPackageLength/> is element of type RandParams.
JobInterval
Defines time space between submission of successive jobs. In other words, this is the difference between submission time of two successive jobs. The value is expressed in seconds.
JobInterval is element of type RandParams.
ComputingResourceHostParameter
Defines generator which creates <hostParameter/> element in task resource requirements section. See GrmsJobDescriptionSchema.xsd for detail description of task resource requirements.
This element requires attribute named: metric. The value of this attribute will be passed to task <hostParameter/> element as a value of its name attribute. The possible values of <hostParameter/> name attribute and thereby <ComputingResourceHostParameter/> metric attribute are: osname, ostype, puarch, osversion, osrelease, memory, freememory, cpucount, freecpus, cpuspeed, application, diskspace, freediskspace, remoteSubmissionInterface, localResourceManager, hostname. In simulation values of cpucount and memory host parameters are used by default. Others are currently ignored.
<ComputingResourceHostParameter/> is element of type RandParams.
Preferences
This is the complex element, which was designed to describe section <preferences/> in task requirements. See GrmsJobDescriptionSchema.xsd for detail description of task resource requirements.
Element <preferences/> consist of list of <parameter/> elements. Each parameter must provide <name/>, <importance/>, <optimizationType/> and <value/> elements. <endpoint/> is optional. The values of these elements are passed to the attributes in parameter element in task resource requirements section. Name of the parameter elements and task parameter attributes are the same.
Workload generated only for simulation purpose does not require section <parameter/> in task resource requirements, therefore element <preferences/> my be skipped in xml workload configuration.
Importance and value are elements of type RandParams.
ExecutionTime
This complex element was designed to describe <ExecutionTime/> section in task description. See GrmsJobDescriptionSchema.xsd for details.
<ExecutionTime/> consists of four child elements which have following interpretation:
- <execDuration/> - describes user expectation about how long the task is. It differs from prior element <TaskLength/> which defines real length of the task. Value of this element is interpreted as number of instructions, and it will be translated into the seconds in the same way as <TaskLength/> is.
- <periodStart/> - defines point in time from which task execution can be started. Value of this element is interpreted as number of seconds after <SimulationStartTime/>.
- <periodEnd/> - defines point in time until task task execution must end. Value of this element is interpreted as number of seconds after <SimulationStartTime/>. It can be used as an alternative for <periodDuration/>.
- <periodDuration/> - defines number of seconds after which task execution must end. This element can be used as an alternative for <periodEnd/>.
<execDuration/>, <periodStart/>, <periodEnd/> and <periodDuration/> are elements of type RandParams.
<ExecutionTime/> element is optional and it is not compulsory to use it in xml workload configuration. However, if advance reservation will be used, then <periodStart/> and <periodEnd/> (<periodDuration/>) are used as a begin and end time of the reservation.
PrecedingConstraints
This element allows to create task workflow. Currently it is not supported in simulation process.
RandParams
RandParams represents set of attributes and elements which are used to configure random numbers generator and the way it is used. The attributes of RandParams type can be divided into two groups:
- defining statistics - following attributes are constraints which must be satisfied by the set of numbers created by generator:
avg - average value, stdev - standard deviation, min - minimum value, max - maximum value, seed - number which initialize generator, distribution - generated set of numbers will have distribution determined by this attribute; possible values are: constant, normal, poisson, uniform, exponential, gamma, harmonic.
- defining dependency - following attributes are used to define dependency between any elements in xml configuration file:
id - element identifier, must be unique in entire file. Value of this attribute is required if value of containing element will be referenced by another element.
refElementId - identifier of the element which is referenced by containing element.
expr - defines dependency function. The x (independent variable) is pointed by the value of refElementId attribute. Defined expression may have any form acceptable by BeanShell interpreter. In general all mathematical operators like +, -, *, /, and brackets (, ) can be used.
Example:
 <ComputingResourceHostParameter metric="memory">
       <value id="memory" refElementId="cpuspeed" expr="x*100"/>
 </ComputingResourceHostParameter>
 <ComputingResourceHostParameter metric="cpuspeed">
       <value id="cpuspeed" refElementId="cpucnt" expr="x+10"/>
 </ComputingResourceHostParameter>
 <ComputingResourceHostParameter metric="cpucount">
       <value id="cpucnt" avg="5" min="2" max="10" stdev="3.0" seed="21" distribution="normal"/>
 </ComputingResourceHostParameter>
The order in which above values are resolved is following: cpucnt -> cpuspeed -> memory.
Value for cpucnt will be calculated based on generator parameters.
Value for cpuspeed will be calculated as a cpucnt generator result + 10; cpuspeed = cpucnt + 10
Value for memory will be calculated as a cpucnt generator result + 10 and multiply by 100; memory = (cpucnt + 10) * 100
Non linear functions can be also defined:
 <ComputingResourceHostParameter metric="memory">
       <value id="memory" refElementId="cpuspeed" expr="x*x"/>
 </ComputingResourceHostParameter>
It is possible to join generator definition with dependency definition. In such case, value of the element is calculated according to the function from expr attribute. The result is then added to the value calculated by the random numbers generator.
Example:
 <ComputingResourceHostParameter metric="cpuspeed">
       <value id="cpuspeed" refElementId="cpucnt" expr="x+10" avg="15" min="10" max="20" stdev="3.0" distribution="normal"/>
 </ComputingResourceHostParameter>
 <ComputingResourceHostParameter metric="cpucount">
       <value id="cpucnt" avg="5" min="2" max="10" stdev="3.0" seed="21" distribution="normal"/>
 </ComputingResourceHostParameter>
If cpucnt = 5, then cpuspeed = 32. Explanation: dependency expression returns 5 + 10 = 15, cpuspeed random numbers generator creates some value, for example 17, so the result is 15 + 17 = 32.
In addition to above list of attributes, RandParams type allows to define two child elements which can be used to define different configuration of generator for some time period or percentage of generated values.
- PeriodicValidValues - attributes of this element defines generator configuration. <BeginValidTime/> child element defines start time of period when this generator configuration is mandatory. <EndValidTime/> child element defines end of this time period. For all time periods which are not covered by the time interval described by <BeginValidTime/> and <EndValidTime/>, generator defined in involving element is mandatory.
Example:
 <execDuration avg="5" min="1" max="10" stdev="3">
   <PeriodicValidValues avg="10" min="1" max="20" stdev=5">
      <BeginValidTime>1970-01-01T01:10:00</BeginValidTime>
      <EndValidTime>1970-01-01T01:20:00</EndValidTime>
   </PeriodicValidValues>
   <PeriodicValidValues avg="20" min="1" max="40" stdev=18">
      <BeginValidTime>1970-01-01T01:30:00</BeginValidTime>
      <EndValidTime>1970-01-01T01:50:00</EndValidTime>
   </PeriodicValidValues>
 </execDuration>
Lets assume, that simulation starts at 1970-01-01T01:00:00 and ends at 1970-01-01T02:00:00. There are three different generator configurations, one in <execDuration/> level and two on <PeriodicValidValues/> level. The interpretation of this configuration is as follows: the average execution duration for tasks which are submitted between 01:10:00 and 01:20:00 equals 10; the average execution duration for tasks which are submitted between 01:30:00 do 01:50:00 equals 20. Average execution durations for tasks which are submitted in any other time period ([01:00:00, 01:10:00], [01:20:00, 01:30:00], [01:50:00, 02:00:00]) equals 5.
- MultiDistribution - allows to define different generator configurations for some percentage of generated values.
Example:
 <execDuration >
   <MultiDistribution>
      <dist avg="5" min="1" max="10" stdev="3" distribution="normal">0.3</dist>
      <dist avg="5" min="1" max="10" stdev="3" distribution="uniform">0.5</dist>
      <dist avg="5" min="1" max="10" stdev="3" distribution="poisson">0.2</dist>
   </MultiDistribution>
 </execDuration>
Interpretation of above configuration is as follows: generator described by normal distribution is used for 30% of generated values, uniform for 50% and poisson for 20%. Percentage values can be interpreted as probability of usage this particular generator.
It is not allowed to use generator configuration attributes (avg, min, max, etc) in involving element if MultiDistribution is used. In such case, all values of <dist/> elements must sum up to 1.0.
Scheduling algorithms
This section contains description of scheduling and resource management concept in DCWoRMS. To facilitate this process, DCWoRMS enables plugging scheduling algorithms into the simulated environment. Each scheduling plugin must implement the following interface.
This interface provides queue management mechanisms for plugin developers. It consists of the following methods:
- getName()
- init()
- getConfiguration()
- schedule() choose which tasks should be moved to execution and which resources should be allocated; may be invoked periodically (when TIMER event occurs). Frequency of TIMER event can be set by adding an <frequency/> element to the scheduling plugin definition in resource description file
- Input: list of queues, list of managed resources, list of all tasks in the system
- Output: scheduling plan
- placeTasksInQueues() is responsible for distributing tasks between queues. New tasks should be placed in queues, and after that, when declared event arrives, moved to execution.
- Input: list of queues, list of managed resources, list of new tasks in the system
- Output: status
In example section an implementation of SchedulingPlugin is described in Scheduling Plugin section
Application performance modeling
DCWoRMS provides means to include specific application performance models during simulations. To this end, additional plugin and interface are included in the DCWoRMS framework. Implementation of this plugin allows researchers to introduce specific ways of calculating task execution time.
The interface consists of method:
execTimeEstimation() calculates the execution time of task
- Input: task, allocated resources, completion percentage, event that caused change in task performance
- Output: estimated execution time of a task
The following parameters can be applied to specify execution time of a task:
- task length (number of CPU instructions)
- task requirements
- detailed description of allocated resources (processor type and parameters, available memory)
- input data size
- network parameters
Based on these parameters an estimated execution time can be calculated in various ways depending on the specific applications and scenarios.
Simulation of energy efficiency
The DCWoRMS allows researchers to take into account energy efficiency issues in distributed computing experiments. To this end appropriate models and profiles must be used. In general, the main goal of the models is to emulate the behavior of the real computing resources, while profiles support models by providing required data. Introducing particular models into the simulation environment is possible through choosing or implementation of dedicated energy plugins that contain methods to calculate power usage of resources. Presence of detailed resource usage information, current resource energy state description and a functional energy management interface enables an implementation of energy-aware scheduling algorithms. Resource energy consumption and thermal metrics become in this context an additional criterion in the resource management process. Scheduling plugins are provided with dedicated interfaces, which allow them to collect detailed information about computing resource components and to affect their behavior.
The DCWoRMS provides a functionality to define the energy efficiency of resources, dependency of energy consumption on resource load and specific applications, and to manage power modes of resources.
Power profile
Power profiles allow introducing information about power usage of resources. Depending on the accuracy of a model, users may provide additional information about power states which are supported by the resources, amounts of energy consumed in these states, as well as general power profiles that provide means to calculate the total energy consumed by the resource during runtime. The above parameter categories may be defined for each element of a computing resource system. It is possible to define any number of new, resource specific, states, for example so called P-states, in which processor can operate.
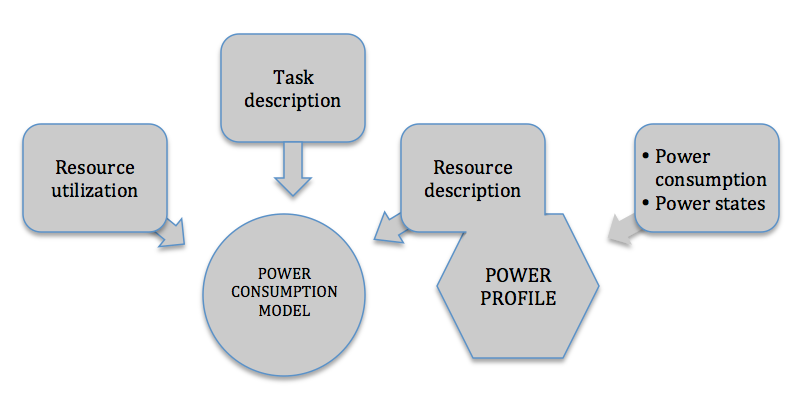
Energy consumption model
The main goal of these models is to emulate the behavior of the real computing resource and the way it consumes energy. Due to a rich functionality and flexible environment description, the DCWoRMS can be used to verify a number of theoretical assumptions and develop new energy consumption models. Relation between model and power profile is illustrated in the following figure.
 .
.
The energy estimation plugin calculates energy consumption based on information about the resources’ power profile, resource utilization, and the application profile including energy consumption and heat production metrics.
The energy consumption models provided by default can be classified into the following groups, starting from the simplest model up to the more complex ones. Users can easily switch between the given models and incorporate new, visionary scenarios.
- Static approach is based on a static definition of resource power usage. This model calculates the total amount of energy consumed by the computing resource system as a sum of energy, consumed by all its components (processors, disks, power adapters, etc.). More advanced versions of this approach assume definition of resource states along with corresponding power usage. This model follows changes of resource power states and sums up the amounts of energy defined for each state.
- Resource load model extends the static power state description and enhances it with real-time resource usage, most often simply the processor load. In this way it enables a dynamic estimation of power usage based on resource basic power usage and state (defined by the static resource description) as well as resource load. For instance, it allows distinguishing between the amount of energy used by idle processors and processors at full load. In this manner, energy consumption is directly connected with power state and describes average power usage by the resource working in a current state.
- Application specific model allows expressing differences in the amount of energy required for executing various types of applications at diverse computing resources. It considers all defined system elements (processors, memory, disk, etc.), which are significant in total energy consumption. Moreover, it also assumes that each of these components can be utilized in a different way during the experiment and thus have different impact on total energy consumption. To this end, specific characteristics of resources and applications are taken into consideration. Various approaches are possible including making the estimated power usage dependent on defined classes of applications, ratio between CPU-bound and IO-bound operations, etc.
Power management interface
The DCWoRMS provides interfaces, which allow scheduling plugins to collect detailed information about computing resource components and to change their power states. It is possible to perform various operations on the given resources, including dynamically changing the frequency level of a single processor, turning off unused resources etc. The activities performed with this interface find a reflection in total amount of energy consumed by the resource during simulation.
Quick start
This section describes how to run an example experiment. Apache Ant is required to compile DCWoRMS and run an experiment.
- Prepare working directory (working_dir) in your local system and download DCWoRMS sources from https://apps.man.poznan.pl/svn/gssim/DCWoRMS/.
The following command can be used to checkout DCWoRMS sources
svn checkout https://apps.man.poznan.pl/svn/gssim/DCWoRMS/
- The example experiments configurations are placed in working_dir/DCWoRMS/trunk/example directory.
- Go to the main project directory working_dir/DCWoRMS/trunk and run Ant task:
Parameters:
run - ant target, it is responsible for compiling source code and starting experiment execution
-Dconfig - path to *.properties file with experiment description
bash$ ant run -Dconfig="example/experiment1/experiment1.properties"
Simulation is started by call of main method from DataCenterWorkloadSimulator class. Input parameter is an array of Strings. First String specifies the path to configuration file. For example:
String args[] = {"example/experiment1.properties"};
DataCenterWorkloadSimulator.main(args);
Prepering experiment
Resource description
As mentioned, the main goal of DCWoRMS is to provide a simulation tool for management resources in data center environments. To this end, user has to provide an appropriate resource decription that defines the simulated resource architecture. It contains both definition of physical topology that may span from computing nodes through racks and containers up to whole data centers or logical architecture with local schedulers, including containers, as well as global schedulung entities like Grid brokers. Morover, the definition contains references to the dedicated plugins that allow reseracher to introduce applciation performance model, specified methods of estimating energy consumption and scheduling algorithms. The following two examples show how to create the resource description.
Data center description
This example guides user throug the stage of simple data center definition
Step 1: Data Center structure
In the first step, we create the structure of single data center. It contains only one rack with 12 computing nodes. In general, the resource description XML schema assumes a recursive definition of computing resources. Thus, each resource contains definition of computing resources that are included within it. The class of computing resource can be provided using the class atribute. The following classes are predefined: DataCenter?, Rack, ComputingNode?, Processor, Core. However, user is able to define his onw, specific classes that will be deliver with genrecic interaface. Count attribute specifies the number of computing resource belonging to particular class.
<?xml version="1.0" encoding="UTF-8"?>
<environment xmlns:xsi="http://www.w3.org/2001/XMLSchema-instance"
        xsi:noNamespaceSchemaLocation="../../simulator/schemas/resources/DCWormsResSchema.xsd">

        <!-- Data center description with some basic characteristics -->
        <resources>
                <computingResource class="DataCenter" name="compRes">
                        <!-- Defined data center contains only 1 rack (if count attribute is not specified a default value=1 is assumed)-->
                        <computingResource class="Rack">
                                <!-- Rack consists of 12 computing nodes -->
                                <computingResource class="ComputingNode" count="8">
                                        <!-- Each of 8 computing nodes contains 2 processors-->
                                        <computingResource class="Processor" count="2">
                                        </computingResource>
                                </computingResource>
                                <computingResource class="ComputingNode" count="4">
                                        <!-- Each of 4 computing nodes contains 2 processors-->
                                        <computingResource class="Processor" count="2">
                                        </computingResource>
                                </computingResource>
                        </computingResource>
                </computingResource>
        </resources>

</environment>
Step 2: Resource characteristics
The second step, presenets how to introduce characteristics and parameters of computing resources. In the example below, we specify the types of computing nodes, distingushing them by the amount of memory and the speed of processors. Moreover, we define the size of the storage mounted at rack level. For now the units of resourceUnit attribute are ommited and their interpretation is left to user. By defaults the speed paramter of resources is expressed in MIPS. Again, user is able to define any number of new resource units and paramteres appropriate to the specific resource. They are accesible in the resorce interfacer throuhg dedicated methods: getResourceCharacteristic().getResourceUnit(ResourceUnitName resUnitName) and getResourceCharacteristic().getParameters().get(String paramName) respectively.
<?xml version="1.0" encoding="UTF-8"?>
<environment xmlns:xsi="http://www.w3.org/2001/XMLSchema-instance"
        xsi:noNamespaceSchemaLocation="../../simulator/schemas/resources/DCWormsResSchema.xsd">

        <!-- Data center description with some basic characteristics -->
        <resources>
                <computingResource class="DataCenter" name="compRes">
                        <!-- Defined data center contains only 1 rack (if count attribute is not specified a default value=1 is assumed)-->
                        <computingResource class="Rack">
                                <!-- Rack contains storage device with capacity=1000000 (unit according to the user interpretation)-->
                                <resourceUnit class="storage">
                                        <amount>1000000</amount>
                                </resourceUnit>
                                <!-- Rack consists of 12 computing nodes, 8 of one type and 4 of another -->
                                <computingResource class="ComputingNode" count="8">
                                        <!-- Each of 8 computing nodes contains memory unit=16384 (unit according to the user interpretation)-->
                                        <resourceUnit class="memory">
                                                <amount>16384</amount>
                                        </resourceUnit>
                                        <!-- Each of 8 computing nodes contains 2 processors with processing speed=1 MIPS-->
                                        <computingResource class="Processor" count="2">
                                                <parameter name="speed">
                                                        <value>1</value>
                                                </parameter>
                                        </computingResource>
                                </computingResource>
                                <computingResource class="ComputingNode" count="4">
                                        <!-- Each of 4 computing nodes contains memory unit=65536(unit according to the user interpretation)-->
                                        <resourceUnit class="memory">
                                                <amount>65536</amount>
                                        </resourceUnit>
                                        <!-- Each of 4 computing nodes contains 2 processors with processing speed=2 MIPS-->
                                        <computingResource class="Processor" count="2">
                                                <parameter name="speed">
                                                        <value>2</value>
                                                </parameter>
                                        </computingResource>
                                </computingResource>
                        </computingResource>
                </computingResource>
        </resources>

</environment>
Step 3: Scheduling entities
The third step shows how to define the scheduling entities. We assume that we create cluster containing all resources belonging to the simulated data center (in our example it manages one rack, and thus, all resources it contains). We define two queues with different priorities (information useful for researchers writing the scheduling plugins) and the scheduling policy (as a reference to the scheduling plugin - see Scheduling Plugin section)
<?xml version="1.0" encoding="UTF-8"?>
<environment xmlns:xsi="http://www.w3.org/2001/XMLSchema-instance"
        xsi:noNamespaceSchemaLocation="../../simulator/schemas/resources/DCWormsResSchema.xsd">

        <!-- Data center description with some basic characteristics -->
        <resources>
                <computingResource class="DataCenter" name="compRes">
                        <!-- Defined data center contains only 1 rack (if count attribute is not specified a default value=1 is assumed)-->
                        <computingResource class="Rack">
                                <!-- Rack contains storage device with capacity=1000000 (unit according to the user interpretation)-->
                                <resourceUnit class="storage">
                                        <amount>1000000</amount>
                                </resourceUnit>
                                <!-- Rack consists of 12 computing nodes, 8 of one type and 4 of another -->
                                <computingResource class="ComputingNode" count="8">
                                        <!-- Each of 8 computing nodes contains memory unit=16384 (unit according to the user interpretation)-->
                                        <resourceUnit class="memory">
                                                <amount>16384</amount>
                                        </resourceUnit>
                                        <!-- Each of 8 computing nodes contains 2 processors with processing speed=1 MIPS-->
                                        <computingResource class="Processor" count="2">
                                                <parameter name="speed">
                                                        <value>1</value>
                                                </parameter>
                                        </computingResource>
                                </computingResource>
                                <computingResource class="ComputingNode" count="4">
                                        <!-- Each of 4 computing nodes contains memory unit=65536(unit according to the user interpretation)-->
                                        <resourceUnit class="memory">
                                                <amount>65536</amount>
                                        </resourceUnit>
                                        <!-- Each of 4 computing nodes contains 2 processors with processing speed=2 MIPS-->
                                        <computingResource class="Processor" count="2">
                                                <parameter name="speed">
                                                        <value>2</value>
                                                </parameter>
                                        </computingResource>
                                </computingResource>
                        </computingResource>
                </computingResource>
                <scheduler class="Cluster" name="cluster">
                        <!-- Definition of scheduling plugin at cluster level -->
                        <schedulingPlugin>
                                <name>example.localplugin.FCFSBF_ClusterPlugin</name>
                        </schedulingPlugin>
                        <!-- Definition of available queues-->
                        <queues>
                                <queue>
                                        <name>queue1</name>
                                        <priority>1</priority>
                                </queue>
                                <queue>
                                        <name>queue2</name>
                                        <priority>2</priority>
                                </queue>
                        </queues>
                        <!-- Reference to managed resources - cluster manages defined rack and all resources belonging to it -->
                        <managedComputingResources include="true">
                                <resourceName>Rack_0</resourceName>
                        </managedComputingResources>
                </scheduler>
        </resources>

</environment>
Step 4: Application performance
The last step show how to introduce application performance plugin to the simulation environment. By default, if not specified, the DefaultTimeEstimationPlugin will be used.
<?xml version="1.0" encoding="UTF-8"?>
<environment xmlns:xsi="http://www.w3.org/2001/XMLSchema-instance"
        xsi:noNamespaceSchemaLocation="../../simulator/schemas/resources/DCWormsResSchema.xsd">

        <timeEstimationPlugin>
                <name>example.timeestimation.NonLinerTimeEstimationPlugin</name>
        </timeEstimationPlugin>

        <!-- Data center description with some basic characteristics -->
        <resources>
                <computingResource class="DataCenter" name="compRes">
                        <!-- Defined data center contains only 1 rack (if count attribute is not specified a default value=1 is assumed)-->
                        <computingResource class="Rack">
                                <!-- Rack contains storage device with capacity=1000000 (unit according to the user interpretation)-->
                                <resourceUnit class="storage">
                                        <amount>1000000</amount>
                                </resourceUnit>
                                <!-- Rack consists of 12 computing nodes, 8 of one type and 4 of another -->
                                <computingResource class="ComputingNode" count="8">
                                        <!-- Each of 8 computing nodes contains memory unit=16384 (unit according to the user interpretation)-->
                                        <resourceUnit class="memory">
                                                <amount>16384</amount>
                                        </resourceUnit>
                                        <!-- Each of 8 computing nodes contains 2 processors with processing speed=1 MIPS-->
                                        <computingResource class="Processor" count="2">
                                                <parameter name="speed">
                                                        <value>1</value>
                                                </parameter>
                                        </computingResource>
                                </computingResource>
                                <computingResource class="ComputingNode" count="4">
                                        <!-- Each of 4 computing nodes contains memory unit=65536(unit according to the user interpretation)-->
                                        <resourceUnit class="memory">
                                                <amount>65536</amount>
                                        </resourceUnit>
                                        <!-- Each of 4 computing nodes contains 2 processors with processing speed=2 MIPS-->
                                        <computingResource class="Processor" count="2">
                                                <parameter name="speed">
                                                        <value>2</value>
                                                </parameter>
                                        </computingResource>
                                </computingResource>
                        </computingResource>
                </computingResource>
                <scheduler class="Cluster" name="cluster">
                        <!-- Definition of scheduling plugin at cluster level -->
                        <schedulingPlugin>
                                <name>example.localplugin.FCFSBF_ClusterPlugin</name>
                        </schedulingPlugin>
                        <!-- Definition of available queues-->
                        <queues>
                                <queue>
                                        <name>queue1</name>
                                        <priority>1</priority>
                                </queue>
                                <queue>
                                        <name>queue2</name>
                                        <priority>2</priority>
                                </queue>
                        </queues>
                        <!-- Reference to managed resources - cluster manages defined rack and all resources belonging to it -->
                        <managedComputingResources include="true">
                                <resourceName>Rack_0</resourceName>
                        </managedComputingResources>
                </scheduler>
        </resources>

</environment>
Data center description with energy characteristics
The second example shows how to introduce energy-related characteristics to the simulated infrastrtucture
Step 1: Data center definition
The first step presents the definition of the data center with one rack containing 4 computing nodes. Moreover, all resources belonging to the data center define the cluster with the given scheduling policy. Since, there is not a queues definition, only one queue will be created.
<?xml version="1.0" encoding="UTF-8"?>
<environment xmlns:xsi="http://www.w3.org/2001/XMLSchema-instance"
        xsi:noNamespaceSchemaLocation="../../simulator/schemas/resources/DCWormsResSchema.xsd">

        <!-- Data Center description with energy parameters -->
        <resources>
                <computingResource class="DataCenter" name="compRes">
                        <!-- Defined data center contains only 1 rack (if count attribute is not specified a default value=1 is assumed) -->
                        <computingResource class="Rack">
                                <!-- Rack consists of 4 computing nodes, 2 of one type and 2 of another -->
                                <computingResource class="ComputingNode" count="2">
                                        <!-- Each of 2 computing nodes contains 4 processors-->
                                        <computingResource class="Processor" count="4">
                                        </computingResource>
                                </computingResource>
                                <computingResource class="ComputingNode" count="2">
                                        <!-- Each of 2 computing nodes contains 4 processors-->
                                        <computingResource class="Processor" count="4">

                                        </computingResource>
                                </computingResource>
                        </computingResource>
                </computingResource>
                <scheduler class="Cluster" name="cluster">
                        <!-- Definition of scheduling plugin at cluster level -->
                        <!-- Switch between scheduling/power management plugins to observe the difference in power consumption -->
                        <schedulingPlugin>
                                <name>example.localplugin.FCFSBF_ClusterPlugin</name>
                                <!--  <name>example.localplugin.FCFSBF_DFSClusterPlugin</name> -->
                        </schedulingPlugin>
                        <!-- Reference to managed resources - cluster manages resources belonging to the defined data center -->
                        <managedComputingResources include="false">
                                <resourceName>compRes</resourceName>
                        </managedComputingResources>
                </scheduler>
        </resources>

</environment>
Step 2: Nodes power profiles
The seconds step extends the previous one with the definition of power profiles at computing node level. This definition includes the specification of supported power states and corresponging power consumption. It is possible to define any number of new power states, appart from predefines ons: ON, OFF, SLEEP, SUSPEND, HIBERNATE.
<?xml version="1.0" encoding="UTF-8"?>
<environment xmlns:xsi="http://www.w3.org/2001/XMLSchema-instance"
        xsi:noNamespaceSchemaLocation="../../simulator/schemas/resources/DCWormsResSchema.xsd">

        <!-- Data Center description with energy parameters -->
        <resources>
                <computingResource class="DataCenter" name="compRes">
                        <!-- Defined data center contains only 1 rack (if count attribute is not specified a default value=1 is assumed) -->
                        <computingResource class="Rack">
                                <!-- Rack consists of 4 computing nodes, 2 of one type and 2 of another -->
                                <computingResource class="ComputingNode" count="2">
                                        <profile>
                                                <!-- Definition of computing node power profile -->
                                                <powerProfile>
                                                        <!-- Definition of supported power states and corresponding power consumption -->
                                                        <!-- Units according to the user interpretation, however statistics chart generator module by default express the values in Watts -->
                                                        <powerStates>
                                                                <powerState>
                                                                        <name>ON</name>
                                                                        <powerUsage>150</powerUsage>
                                                                </powerState>
                                                                <powerState>
                                                                        <name>OFF</name>
                                                                        <powerUsage>0</powerUsage>
                                                                </powerState>
                                                        </powerStates>
                                                </powerProfile>
                                        </profile>
                                        <!-- Each of 2 computing nodes contains 4 processors-->
                                        <computingResource class="Processor" count="4">
                                        </computingResource>
                                </computingResource>
                                <computingResource class="ComputingNode" count="2">
                                        <profile>
                                                <!-- Definition of computing node power profile -->
                                                <powerProfile>
                                                        <!-- Definition of supported power states and corresponding power consumption -->
                                                        <!-- Units according to the user interpretation, however statistics chart generator module by default express the values in Watts -->
                                                        <powerStates>
                                                                <powerState>
                                                                        <name>ON</name>
                                                                        <powerUsage>150</powerUsage>
                                                                </powerState>
                                                                <powerState>
                                                                        <name>OFF</name>
                                                                        <powerUsage>0</powerUsage>
                                                                </powerState>
                                                        </powerStates>
                                                </powerProfile>
                                        </profile>
                                        <!-- Each of 2 computing nodes contains 4 processors-->
                                        <computingResource class="Processor" count="4">

                                        </computingResource>
                                </computingResource>
                        </computingResource>
                </computingResource>
                <scheduler class="Cluster" name="cluster">
                        <!-- Definition of scheduling plugin at cluster level -->
                        <!-- Switch between scheduling/power management plugins to observe the difference in power consumption -->
                        <schedulingPlugin>
                                <name>example.localplugin.FCFSBF_ClusterPlugin</name>
                                <!--  <name>example.localplugin.FCFSBF_DFSClusterPlugin</name> -->
                        </schedulingPlugin>
                        <!-- Reference to managed resources - cluster manages resources belonging to the defined data center -->
                        <managedComputingResources include="false">
                                <resourceName>compRes</resourceName>
                        </managedComputingResources>
                </scheduler>
        </resources>

</environment>
Step 3: Processors P-states
This step introduce specification of processors P-States. To this end the processor power profiles, has to be extended with the definition of additional parameteres with appropriate names.
<?xml version="1.0" encoding="UTF-8"?> <environment xmlns:xsi="http://www.w3.org/2001/XMLSchema-instance" xsi:noNamespaceSchemaLocation="../../simulator/schemas/resources/DCWormsResSchema.xsd"> <!-- Data Center description with energy parameters --> <resources> <computingResource class="DataCenter" name="compRes"> <!-- Defined data center contains only 1 rack (if count attribute is not specified a default value=1 is assumed) --> <computingResource class="Rack"> <!-- Rack consists of 4 computing nodes, 2 of one type and 2 of another --> <computingResource class="ComputingNode" count="2"> <profile> <!-- Definition of computing node power profile --> <powerProfile> <!-- Definition of supported power states and corresponding power consumption --> <!-- Units according to the user interpretation, however statistics chart generator module by default express the values in Watts --> <powerStates> <powerState> <name>ON</name> <powerUsage>150</powerUsage> </powerState> <powerState> <name>OFF</name> <powerUsage>0</powerUsage> </powerState> </powerStates> </powerProfile> </profile> <!-- Each of 2 computing nodes contains 4 processors--> <computingResource class="Processor" count="4"> <profile> <!-- Definition of processor power profile --> <powerProfile> <!-- Definition of supported p-states and corresponding frequency and voltage level and power consumption --> <!-- Units according to the user interpretation, however, as far as power usage is concerned, statistics chart generator module by default express the values in Watts --> <parameter name="pState"> <property name="name"> <value>P0</value> </property> <property name="frequency"> <value unit="Hz">3000</value> </property> <property name="voltage"> <value unit="V">0</value> </property> <property name="powerUsage"> <value unit="W">350</value> </property> </parameter> <parameter name="pState"> <property name="name"> <value>P1</value> </property> <property name="frequency"> <value unit="H`">2660</value> </property> <property name="voltage"> <value unit="V">0</value> </property> <property name="powerUsage"> <value unit="W">343</value> </property> </parameter> <parameter name="pState"> <property name="name"> <value>P2</value> </property> <property name="frequency"> <value unit="H`">2330</value> </property> <property name="voltage"> <value unit="V">0</value> </property> <property name="powerUsage"> <value unit="W">337</value> </property> </parameter> <parameter name="pState"> <property name="name"> <value>P3</value> </property> <property name="frequency"> <value unit="H`">2000</value> </property> <property name="voltage"> <value unit="V">0</value> </property> <property name="powerUsage"> <value unit="W">330</value> </property> </parameter> </powerProfile> </profile> </computingResource> </computingResource> <computingResource class="ComputingNode" count="2"> <profile> <!-- Definition of computing node power profile --> <powerProfile> <!-- Definition of supported power states and corresponding power consumption --> <!-- Units according to the user interpretation, however statistics chart generator module by default express the values in Watts --> <powerStates> <powerState> <name>ON</name> <powerUsage>150</powerUsage> </powerState> <powerState> <name>OFF</name> <powerUsage>0</powerUsage> </powerState> </powerStates> </powerProfile> </profile> <!-- Each of 2 computing nodes contains 4 processors--> <computingResource class="Processor" count="4"> <profile> <!-- Definition of processor power profile --> <powerProfile> <!-- Definition of supported p-states and corresponding frequency and voltage level and power consumption --> <!-- Units according to the user interpretation, however, as far as power usage is concerned, statistics chart generator module by default express the values in Watts --> <parameter name="pState"> <property name="name"> <value>P0</value> </property> <property name="frequency"> <value unit="Hz">3000</value> </property> <property name="voltage"> <value unit="V">0</value> </property> <property name="powerUsage"> <value unit="W">350</value> </property> </parameter> <parameter name="pState"> <property name="name"> <value>P1</value> </property> <property name="frequency"> <value unit="H`">2660</value> </property> <property name="voltage"> <value unit="V">0</value> </property> <property name="powerUsage"> <value unit="W">343</value> </property> </parameter> <parameter name="pState"> <property name="name"> <value>P2</value> </property> <property name="frequency"> <value unit="H`">2330</value> </property> <property name="voltage"> <value unit="V">0</value> </property> <property name="powerUsage"> <value unit="W">337</value> </property> </parameter> <parameter name="pState"> <property name="name"> <value>P3</value> </property> <property name="frequency"> <value unit="H`">2000</value> </property> <property name="voltage"> <value unit="V">0</value> </property> <property name="powerUsage"> <value unit="W">330</value> </property> </parameter> </powerProfile> </profile> </computingResource> </computingResource> </computingResource> </computingResource> <scheduler class="Cluster" name="cluster"> <!-- Definition of scheduling plugin at cluster level --> <!-- Switch between scheduling/power management plugins to observe the difference in power consumption --> <schedulingPlugin> <name>example.localplugin.FCFSBF_ClusterPlugin</name> <!-- <name>example.localplugin.FCFSBF_DFSClusterPlugin</name> --> </schedulingPlugin> <!-- Reference to managed resources - cluster manages resources belonging to the defined data center --> <managedComputingResources include="false"> <resourceName>compRes</resourceName> </managedComputingResources> </scheduler> </resources> </environment>
Step 4: Energy estimation plugins
In this step we incorporate energy estimation plugins into the simulated infrastructure. They are plugged into the computing node and processor level. Energy consumption calculations will be performed only for the selected resources. Thus, according to our example, information about current energy usage and the generated statistics will be available only for computing nodes and processors. As DCWoRMS is provided with a set of dedicated plugins, it is possible to refer to the DefaultEnergyEstimationPlugin which simply collects information from the lower levels (for which the calculations are made) and adds the current energy consumption accroding to the current power state.
<?xml version="1.0" encoding="UTF-8"?> <environment xmlns:xsi="http://www.w3.org/2001/XMLSchema-instance" xsi:noNamespaceSchemaLocation="../../simulator/schemas/resources/DCWormsResSchema.xsd"> <!-- Data Center description with energy parameters --> <resources> <computingResource class="DataCenter" name="compRes"> <!-- Defined data center contains only 1 rack (if count attribute is not specified a default value=1 is assumed) --> <computingResource class="Rack"> <!-- Rack consists of 4 computing nodes, 2 of one type and 2 of another --> <computingResource class="ComputingNode" count="2"> <profile> <!-- Definition of computing node power profile --> <powerProfile> <!-- Reference to energy usage estimation plugin --> <energyEstimationPlugin> <name>example.energy.ComputingNodeEnergyEstimationPlugin</name> </energyEstimationPlugin> <!-- Definition of supported power states and corresponding power consumption --> <!-- Units according to the user interpretation, however statistics chart generator module by default express the values in Watts --> <powerStates> <powerState> <name>ON</name> <powerUsage>150</powerUsage> </powerState> <powerState> <name>OFF</name> <powerUsage>0</powerUsage> </powerState> </powerStates> </powerProfile> </profile> <!-- Each of 2 computing nodes contains 4 processors--> <computingResource class="Processor" count="4"> <profile> <!-- Definition of processor power profile --> <powerProfile> <!-- Reference to energy usage estimation plugin --> <energyEstimationPlugin> <name>example.energy.CPUEnergyEstimationPlugin</name> </energyEstimationPlugin> <!-- Definition of supported p-states and corresponding frequency and voltage level and power consumption --> <!-- Units according to the user interpretation, however, as far as power usage is concerned, statistics chart generator module by default express the values in Watts --> <parameter name="pState"> <property name="name"> <value>P0</value> </property> <property name="frequency"> <value unit="Hz">3000</value> </property> <property name="voltage"> <value unit="V">0</value> </property> <property name="powerUsage"> <value unit="W">350</value> </property> </parameter> <parameter name="pState"> <property name="name"> <value>P1</value> </property> <property name="frequency"> <value unit="H`">2660</value> </property> <property name="voltage"> <value unit="V">0</value> </property> <property name="powerUsage"> <value unit="W">343</value> </property> </parameter> <parameter name="pState"> <property name="name"> <value>P2</value> </property> <property name="frequency"> <value unit="H`">2330</value> </property> <property name="voltage"> <value unit="V">0</value> </property> <property name="powerUsage"> <value unit="W">337</value> </property> </parameter> <parameter name="pState"> <property name="name"> <value>P3</value> </property> <property name="frequency"> <value unit="H`">2000</value> </property> <property name="voltage"> <value unit="V">0</value> </property> <property name="powerUsage"> <value unit="W">330</value> </property> </parameter> </powerProfile> </profile> </computingResource> </computingResource> <computingResource class="ComputingNode" count="2"> <profile> <!-- Definition of computing node power profile --> <powerProfile> <!-- Reference to energy usage estimation plugin --> <energyEstimationPlugin> <name>example.energy.ComputingNodeEnergyEstimationPlugin</name> </energyEstimationPlugin> <!-- Definition of supported power states and corresponding power consumption --> <!-- Units according to the user interpretation, however statistics chart generator module by default express the values in Watts --> <powerStates> <powerState> <name>ON</name> <powerUsage>150</powerUsage> </powerState> <powerState> <name>OFF</name> <powerUsage>0</powerUsage> </powerState> </powerStates> </powerProfile> </profile> <!-- Each of 2 computing nodes contains 4 processors--> <computingResource class="Processor" count="4"> <profile> <!-- Definition of processor power profile --> <powerProfile> <!-- Reference to energy usage estimation plugin --> <energyEstimationPlugin> <name>example.energy.CPUEnergyEstimationPlugin</name> </energyEstimationPlugin> <!-- Definition of supported p-states and corresponding frequency and voltage level and power consumption --> <!-- Units according to the user interpretation, however, as far as power usage is concerned, statistics chart generator module by default express the values in Watts --> <parameter name="pState"> <property name="name"> <value>P0</value> </property> <property name="frequency"> <value unit="Hz">3000</value> </property> <property name="voltage"> <value unit="V">0</value> </property> <property name="powerUsage"> <value unit="W">350</value> </property> </parameter> <parameter name="pState"> <property name="name"> <value>P1</value> </property> <property name="frequency"> <value unit="H`">2660</value> </property> <property name="voltage"> <value unit="V">0</value> </property> <property name="powerUsage"> <value unit="W">343</value> </property> </parameter> <parameter name="pState"> <property name="name"> <value>P2</value> </property> <property name="frequency"> <value unit="H`">2330</value> </property> <property name="voltage"> <value unit="V">0</value> </property> <property name="powerUsage"> <value unit="W">337</value> </property> </parameter> <parameter name="pState"> <property name="name"> <value>P3</value> </property> <property name="frequency"> <value unit="H`">2000</value> </property> <property name="voltage"> <value unit="V">0</value> </property> <property name="powerUsage"> <value unit="W">330</value> </property> </parameter> </powerProfile> </profile> </computingResource> </computingResource> </computingResource> </computingResource> <scheduler class="Cluster" name="cluster"> <!-- Definition of scheduling plugin at cluster level --> <!-- Switch between scheduling/power management plugins to observe the difference in power consumption --> <schedulingPlugin> <name>example.localplugin.FCFSBF_ClusterPlugin</name> <!-- <name>example.localplugin.FCFSBF_DFSClusterPlugin</name> --> </schedulingPlugin> <!-- Reference to managed resources - cluster manages resources belonging to the defined data center --> <managedComputingResources include="false"> <resourceName>compRes</resourceName> </managedComputingResources> </scheduler> </resources> </environment>
Workload description
As mentioned, as a basic description, DCWoRMS uses files in the Standard Workload Format (SWF). Example files can be obtained directly from http://www.cs.huji.ac.il/labs/parallel/workload
Workload generation
The main purpose of the workload generator tool is to create synthetic workloads. It generates standard SWF workloads as well as additional parameters in auxiliary file (in the XML format). This section shows how to generate the sample workload.
The run the workload generator tool user needs to provide a configuration file. Path to this configuration file is the main argument of the DCWoRMS workload generetor. It should be used as follows:
java simulator.workload.generator.WorkloadGenerator path/to/workloadGenerator.properties
Example configuration file is presented below.
resdesc=example/workgen/resources.xml
createscenario.tasksdesc=example/workgen/conf1/GeneratorConfig.xml
createscenario.outputfolder=example/workgen/workload
createscenario.workloadfilename=workload.swf
createscenario.overwrite_files=true
Proper execution of workload generator requires:
- workload characteristic file - pointed by the createscenario.tasksdesc parameter WorkloadSchema.xsd
- description of resources - resdesc - the same which will be used for experiment execution
The following listing emphasise all main features of workload charateceristic file.
The example specification have following interpretation:
- Simulator will start with initial date: 15.01.2009 at 10:00:00. This time is used as a start date each time the experiment is executed. All other time values (like submit time) are calculated as number of seconds after this initial date.
- Generator will produce 1000 jobs with only one task each. There are no deviations from this values, because both <JobCount/?> and <TaskCount/?> have constant distribution.
- The length of each task will vary between 10800 and 18000 instructions, but the in the average it will be around 14400 instructions.
- Job package length is set to 1, therefore all jobs will have different submit time.
- Next task will be submitted minimum 0 and maximum 100 seconds after submission of the following one. The average distance between submission of two tasks will be around 50 seconds.
- There are 2 different generator definitions for cpucnt resource requirement. For 95% of tasks value of cpucnt resource requirement will be equal 1. For rest 5% of tasks value of the same requirement will be equal 4.
- The value of memory resource requirement is defined as function of cpucount value. Generator will use definition with id=cpucnt and then multiply this value by 1024. The result of this calculation will be set as memory resource requirement value.
<tns:WorkloadConfiguration
        xmlns:tns="http://www.man.poznan.pl/WorkloadSchema"
        xmlns:xsi="http://www.w3.org/2001/XMLSchema-instance">

        <SimulationStartTime>2009-01-15T10:00:00</SimulationStartTime>

        <JobCount avg="1000" distribution="constant"/>

        <TaskCount avg="1" distribution="constant"/>

        <TaskLength avg="14400" min="10800" max="18000" stdev="3600.0" distribution="normal"/>

        <JobPackageLength avg="1.0" min="1.0" max="1.0" stdev="0.0" distribution="constant"/>

        <JobInterval avg="50" min="0" max="100" stdev="30" distribution="poisson" seed="21"/>

        <ComputingResourceHostParameter metric="cpucount">
                <value id="cpucnt">
                        <MultiDistribution>
                        <dist avg="1" min="1" max="1" stdev="0" distribution="uniform">0.95</dist>
                        <dist avg="4" min="4" max="4" stdev="0" distribution="uniform">0.05</dist>
                        </MultiDistribution>
                </value>
        </ComputingResourceHostParameter>

        <ComputingResourceHostParameter metric="memory">
                <value id="memory" refElementId="cpucnt"  expr="x*1024"/>
        </ComputingResourceHostParameter>

</tns:WorkloadConfiguration>
Scheduling Plugin
FCFS with Backfilling strategy local scheduling plugin
public class FCFSBF_LocalPlugin extends BaseLocalSchedulingPlugin {

        public SchedulingPlan schedule(SchedulingEvent event, TaskQueueList queues, JobRegistry jobRegistry,
                         ResourceManager resManager, ModuleList modules) {

                SchedulingPlan plan = new SchedulingPlan();
                // Chose the events types to serve. Different actions for different events are possible.
                switch (event.getType()) {
                case START_TASK_EXECUTION:
                case TASK_FINISHED:

                        // our tasks are placed only in first queue (see BaseLocalPlugin.placeJobsInQueues() method)
                        TaskQueue q = queues.get(0);

                        // check all tasks in queue
                        for (int i = 0; i < q.size(); i++) {
                                TaskInterface<?> task = q.get(i);

                                // if status of the tasks in READY
                                if (task.getStatus() == DCWormsTags.READY) {
                                        addToSchedulingPlan(plan, task);
                                }
                        }
                        break;
                }
                return plan;
        }

}
FCFS with Backfilling strategy + DFS (Dynamic Frequency Scalling) local scheduling plugin
public class FCFSBF_DFSClusterPlugin extends BaseLocalSchedulingPlugin {

        public SchedulingPlanInterface<?> schedule(SchedulingEvent event, TaskQueueList queues, JobRegistry jobRegistry,
                        ResourceManager resManager, ModuleList modules) {

                ClusterResourceManager resourceManager = (ClusterResourceManager) resManager;
                SchedulingPlan plan = new SchedulingPlan();
                // our tasks are placed only in first queue (see
                // BaseLocalSchedulingPlugin.placeJobsInQueues() method)
                TaskQueue q = queues.get(0);
                switch (event.getType()) {

                case START_TASK_EXECUTION:
                case TASK_FINISHED:

                        // check all tasks in queue
                        for (int i = 0; i < q.size(); i++) {
                                TaskInterface<?> task = q.get(i);

                                // if status of the tasks in READY
                                if (task.getStatus() == DCWormsTags.READY) {
                                        addToSchedulingPlan(plan, task);
                                }
                        }
                        adjustFrequency(resourceManager.getProcessors());
                }
                return plan;
        }
        // scale-up the frequency of allocated processors and scale-down the frequency of free ones
        private void adjustFrequency(List<Processor> processors){

                for(Processor cpu: processors){
                        if(cpu.getStatus() == ResourceStatus.FREE) {
                                if(cpu.getPowerInterface().getSupportedPStates().containsKey("P3"))
                                        cpu.getPowerInterface().setPState("P3");
                        }
                        else{
                                if(cpu.getPowerInterface().getSupportedPStates().containsKey("P0"))
                                        cpu.getPowerInterface().setPState("P0");
                        }
                }
        }

}
Application performance plugin
public class DefaultTimeEstimationPlugin extends BaseTimeEstimationPlugin{

        /*
         * This method should return an estimation of time required to execute the task.
         * Requested calculation should be done based on the resources allocated for the task,
         * task description and task completion percentage.
         *
         * Example implementation calculate the estimation based on cpu processing power.
         * There is also a simple assumption, that cpu processing power is a linear function
         * of number of allocated cpus and their speed.
         */
        public double execTimeEstimation(SchedulingEvent event, ExecTask task,
                        Map<ResourceUnitName, ResourceUnit> allocatedResources,
                        double completionPercentage) {

                // collect all information necessary to do the calculation
                PEUnit peUnit = (PEUnit) allocatedResources.get(StandardResourceUnitName.PE);

                // obtain single pe speed
                int speed = peUnit.getSpeed();

                // number of used pe
                int cnt = peUnit.getUsedAmount();

                // estimate remainingTaskLength
                double remainingLength =  task.getLength() * (1 - completionPercentage/100);

                // do the calculation
                double execTime = (remainingLength / (cnt * speed));

                // if the result is very close to 0, but less then one millisecond then round this result to 0.001
                if (Double.compare(execTime, 0.001) < 0) {
                        execTime = 0.001;
                }

                // time is measured in integer units, so get the nearest execTime int value.
                execTime = Math.ceil(execTime);
                return execTime;
        }

}
Energy estimation plugin
CPU energy estimation plugin
public class CPUEnergyEstimationPlugin extends BaseEnergyEstimationPlugin  {

        public double estimatePowerConsumption(EnergyEvent event, JobRegistry jobRegistry,
                        ComputingResource resource) {
                double powerConsumption;
                Processor cpu = (Processor)resource;
                if(resource.getPowerInterface().getPowerState().equals(StandardPowerStateName.OFF))
                        powerConsumption = 0;
                else {
                        try {
                                return cpu.getPowerInterface().getPowerConsumption(cpu.getPowerInterface().getPState());
                        } catch (NoSuchFieldException e) {
                                try {
                                        return cpu.getPowerInterface().getPowerConsumption(StandardPowerStateName.ON);
                                } catch (NoSuchFieldException e1) {
                                        powerConsumption = 1;
                                }
                        }
                }
                return powerConsumption;
        }

}
Computing Node energy estimation plugin
public class ComputingNodeEnergyEstimationPlugin extends BaseEnergyEstimationPlugin {

        public double estimatePowerConsumption(EnergyEvent event, JobRegistry jobRegistry,
                        ComputingResource resource) {
                double powerConsumption = 0;
                ComputingNode node = (ComputingNode) resource;
                for(Processor cpu: node.getProcessors()){
                        powerConsumption = powerConsumption + cpu.getPowerInterface().getRecentPowerUsage().getValue();
                }
                try {
                        powerConsumption = powerConsumption + node.getPowerInterface().getPowerConsumption(node.getPowerInterface().getPowerState());
                } catch (NoSuchFieldException e) {
                }

                return powerConsumption;
        }

}
Configuration File
Example configuration file:
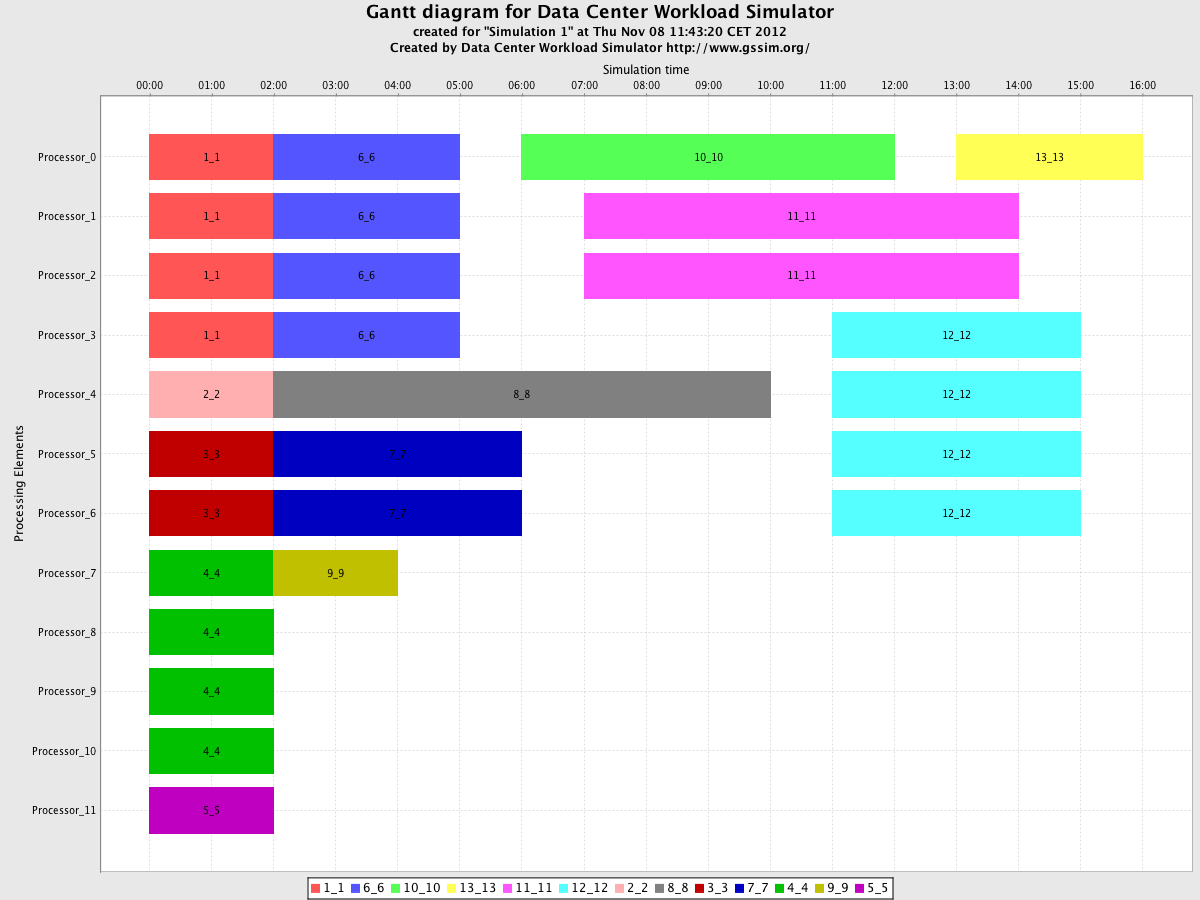
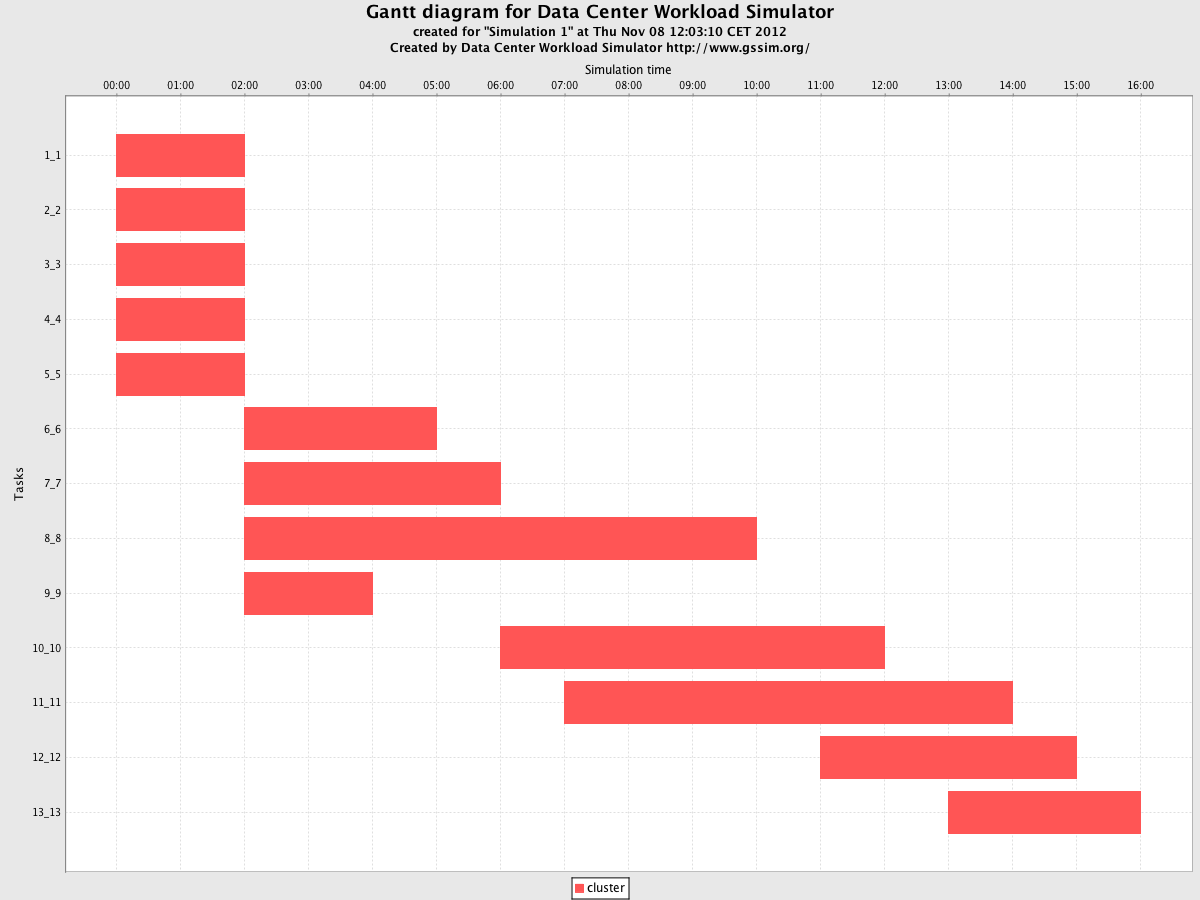
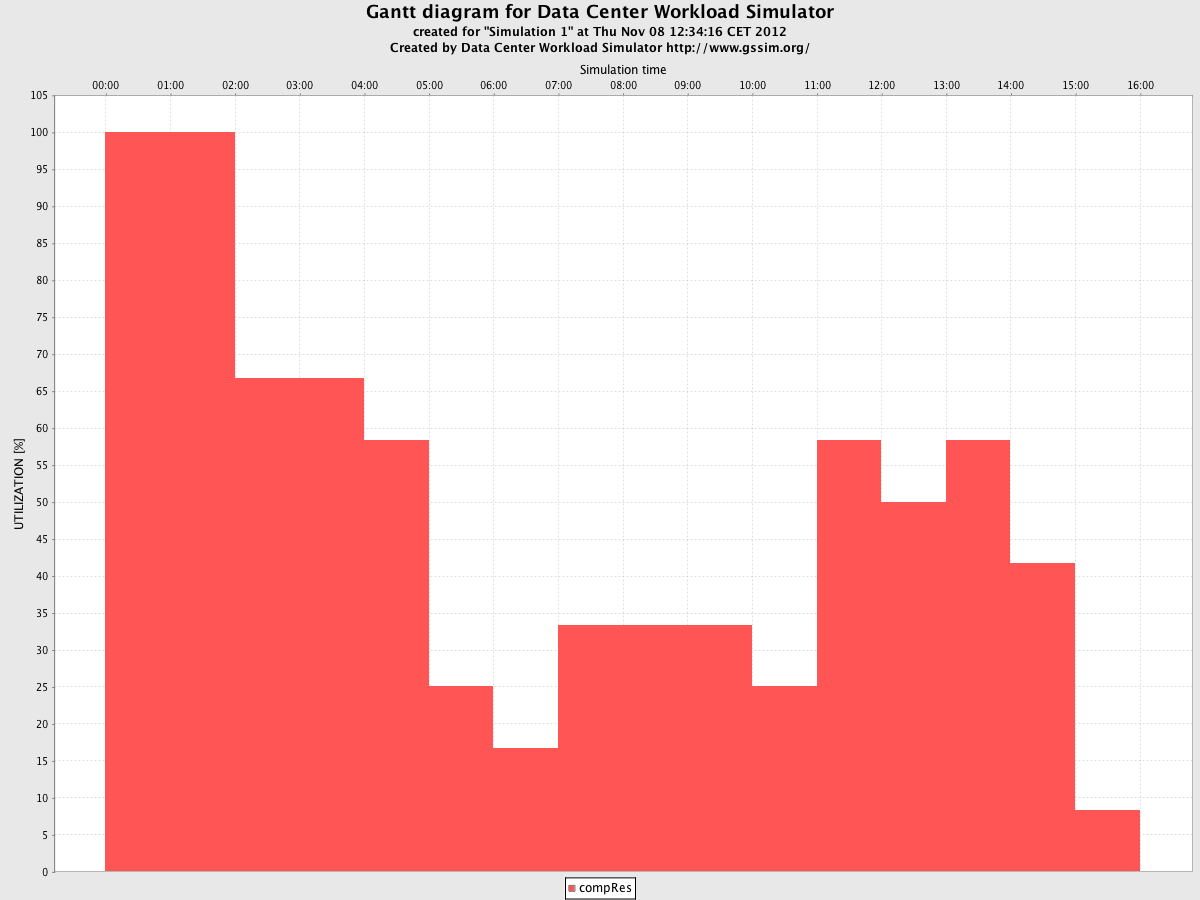
 # Use single *.swf file as workload description.
 # Path to xml file which describes resource characteristics.
 resdesc=example/experiment1/resources1.xml

 # and swf file, which name is declared by readscenario.workloadfilename parameter.
 # Swf file must be placed in readscenario.inputfolder directory.
 readscenario.workloadfilename=example/experiment1/workload.swf

 # Choose directory where all result files should be placed.
 stats.outputfolder=../experiment1_result

 # Define the type and content of charts to generate
 # Gantt chart
 creatediagrams.gantt=true
 # Shows the execution times of tasks
 creatediagrams.tasks=true
 # Shows the waiting times of tasks
 creatediagrams.taskswaitingtime=true
 # Resource utilization chart - only for processors
 creatediagrams.resutilization=Processor
As we can see, it is necessary to specify resource description file. This file should be valid with DCWormsResSchema.xsd. It should contain description of resources (e.g. number of processors, their speed, memory etc.). Furthermore, workload file is necessary to obtain information concerned with execution of simulation (e.g. execution of tasks). This workload file should be in the standard workload format ( http://www.cs.huji.ac.il/labs/parallel/workload/swf.html)
Attachments
-
powerModel.png
 (49.5 KB) -
added by wojtekp 12 years ago.
(49.5 KB) -
added by wojtekp 12 years ago.
-
Chart_Simulation 1_Gantt.png
(48.4 KB) -
added by wojtekp 12 years ago.
-
Chart_Simulation 1_Tasks.png
(34.8 KB) -
added by wojtekp 12 years ago.
-
Chart_Simulation 1_Waiting_Time.png
(37.7 KB) -
added by wojtekp 12 years ago.
-
Chart_Simulation 1_Resources Load - DataCenter.png
(39.9 KB) -
added by wojtekp 12 years ago.
-
Chart_Simulation 1_Energy - DataCenter.png
(49.5 KB) -
added by wojtekp 12 years ago.
-
arch.png
(232.0 KB) -
added by wojtekp 9 years ago.
